Grafana Visualization Connector Guide
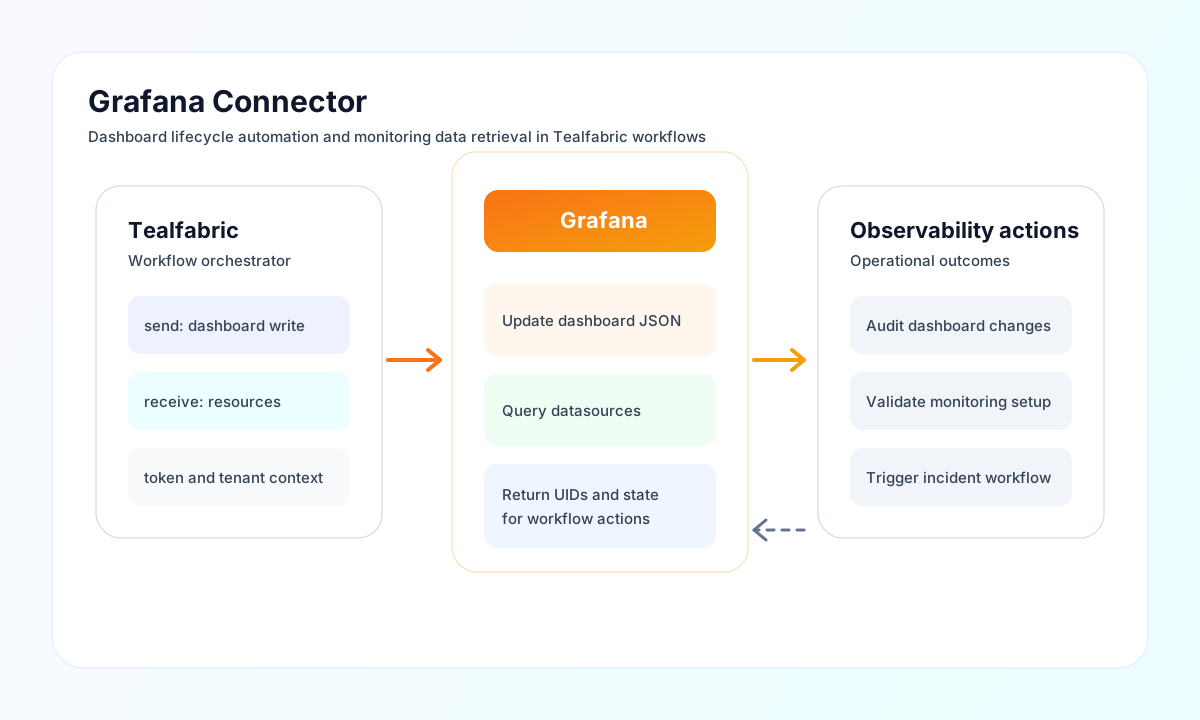
The Grafana connector lets Tealfabric workflows manage dashboards and retrieve observability data through Grafana HTTP APIs. It is useful for monitoring automation, alerting workflows, and dashboard lifecycle management in platform operations.
Document information
| Field | Value |
|---|---|
| Canonical URL | /docs/04_connecting-systems/connectors/g/grafana |
| Version (published date) | 2026-05-08 |
| Tags | connectors, reference, grafana |
| Connector ID | grafana-1.0.0 |
Configure Grafana endpoint and token
Set base_url to your Grafana instance and api_key to a token with permissions for the resources your workflow needs, such as dashboards, folders, or datasources. Use a scoped service token to reduce risk and simplify auditing.
Set timeout_seconds based on query complexity and expected response time. Run test after setup to verify authentication and API access before enabling production automations.
Create or update dashboards with send
Use send for write operations, such as creating or updating dashboard definitions. Keep dashboard UID and title conventions stable so downstream automation can reference dashboards predictably.
Provide endpoint as the path segment under Grafana /api (for example, dashboards/db). Do not include the api/ prefix because the connector always sends requests to {base_url}/api/{endpoint}.
const baseUrl = "https://api.example.com/api/v1";
const tenantId = "<TENANT_ID>";
const apiKey = "<API_KEY>";

async function upsertDashboard(integrationId: string) {
  const response = await fetch(`${baseUrl}/integrations/${encodeURIComponent(integrationId)}/execute`, {
    method: "POST",
    headers: {
      "X-API-Key": apiKey,
      "X-Tenant-ID": tenantId,
      "Content-Type": "application/json",
    },
    body: JSON.stringify({
      operation: "send",
      endpoint: "dashboards/db",
      method: "POST",
      data: {
        dashboard: {
          uid: "ops-overview",
          title: "Operations Overview",
          tags: ["tealfabric", "platform"],
          schemaVersion: 39,
          version: 1
        },
        overwrite: true
      }
    }),
  });
  if (!response.ok) throw new Error(`Request failed: ${response.status}`);
  return response.json();
}
curl -X POST "https://api.example.com/api/v1/integrations/<ENTITY_ID>/execute" \
-H "X-API-Key: <API_KEY>" \
-H "X-Tenant-ID: <TENANT_ID>" \
-H "Content-Type: application/json" \
-d '{
"operation": "send",
"endpoint": "dashboards/db",
"method": "POST",
"data": {
"dashboard": {
"uid": "ops-overview",
"title": "Operations Overview",
"tags": ["tealfabric", "platform"],
"schemaVersion": 39,
"version": 1
},
"overwrite": true
}
}'
{
  "success": true,
  "data": {
    "message": "Grafana operation completed successfully",
    "result": {
      "status": "success",
      "uid": "ops-overview",
      "version": 1
    }
  }
}
Retrieve dashboards and resources with receive
Use receive to fetch dashboards, datasources, and related metadata for reporting or drift detection workflows. Limit scope and paginate large result sets to keep automation runs efficient.
{
  "operation": "receive",
  "endpoint": "search",
  "query": {
    "type": "dash-db",
    "limit": 20,
    "page": 1
  }
}
{
  "success": true,
  "data": {
    "message": "Grafana data retrieved successfully",
    "result": {
      "items": []
    }
  }
}
Validate connectivity with test
Use test to validate required configuration and check authentication against GET /api/user.
{
  "operation": "test"
}
{
  "success": true,
  "data": {
    "message": "Grafana connection test successful",
    "details": {
      "base_url": "https://grafana.example.com",
      "user": "service-account"
    }
  }
}
Reliability and governance guidance
Common failures include invalid API tokens, insufficient role permissions, and dashboard schema mismatches on update requests. Validate token scope first, then confirm payload shape against your Grafana version.
For stable operations, treat dashboard JSON as versioned configuration, apply retries with backoff for transient errors, and log dashboard UID changes for auditability. This supports predictable and maintainable observability automation.