Prometheus Connector Guide
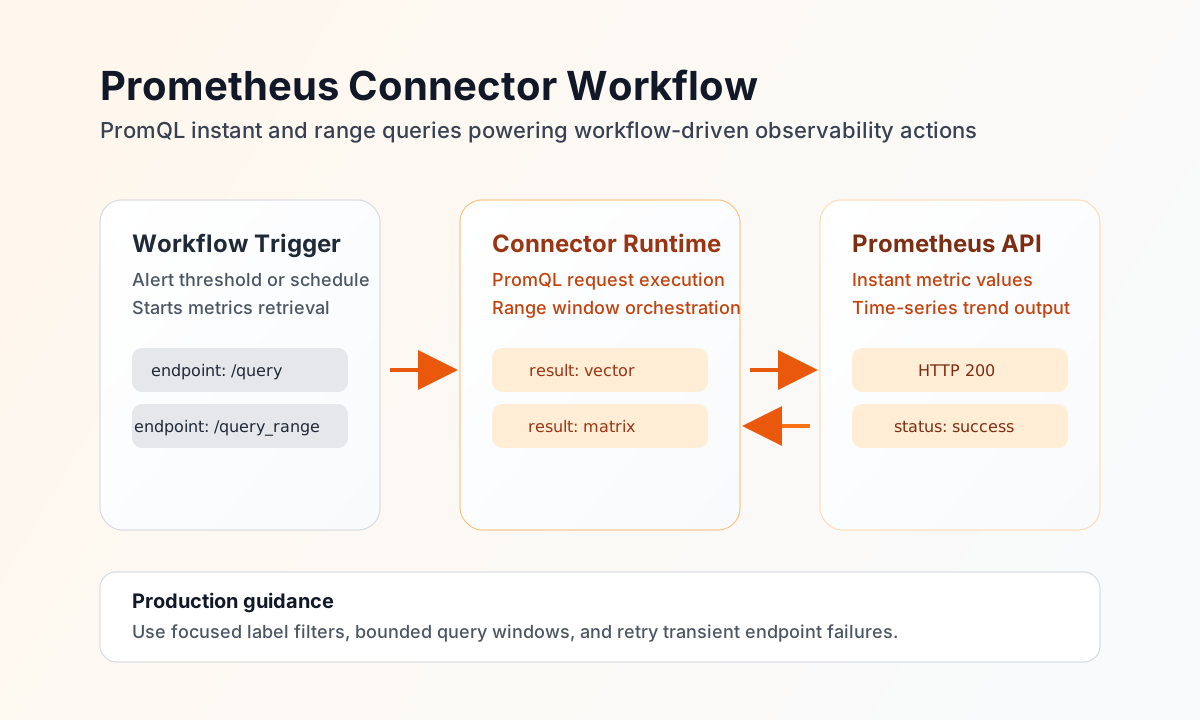
The Prometheus connector helps Tealfabric workflows query time-series monitoring data for alerting, reporting, and automated incident handling. It is suited for teams that need to pull metrics from Prometheus and use them directly in operational workflows.
Document information
| Field | Value |
|---|---|
| Canonical URL | /docs/04_connecting-systems/connectors/p/prometheus |
| Version (published date) | 2026-05-08 |
| Tags | connectors, reference, prometheus |
| Connector ID | prometheus-1.0.0 |
Configuration and connection
Configure the connector with your Prometheus base URL so instant and range queries can reach the HTTP API reliably.
endpoint_url(required): Prometheus HTTP endpoint, for examplehttp://localhost:9090orhttps://prometheus.example.com.timeout_seconds(optional): request timeout in seconds (default30).
After configuration, run test to validate connectivity (GET /api/v1/status/config) before enabling recurring jobs. When endpoint_url is missing or empty, test returns Configuration validation failed (legacy parity).
Run instant PromQL queries with query
Use query for instant PromQL evaluation (GET /api/v1/query). Optionally pass time to evaluate at a specific timestamp; the parameter is omitted only when null or undefined (empty string and 0 are still sent, matching legacy behavior).
const baseUrl = "https://api.example.com/api/v1";
const tenantId = "<TENANT_ID>";
const apiKey = "<API_KEY>";

async function queryCpuUsage(integrationId: string) {
  const response = await fetch(`${baseUrl}/integrations/${encodeURIComponent(integrationId)}/execute`, {
    method: "POST",
    headers: {
      "X-API-Key": apiKey,
      "X-Tenant-ID": tenantId,
      "Content-Type": "application/json",
    },
    body: JSON.stringify({
      operation: "query",
      query: "sum(rate(container_cpu_usage_seconds_total{namespace='prod'}[5m]))"
    }),
  });
  if (!response.ok) throw new Error(`Request failed: ${response.status}`);
  return response.json();
}
curl -X POST "https://api.example.com/api/v1/integrations/<ENTITY_ID>/execute" \
-H "X-API-Key: <API_KEY>" \
-H "X-Tenant-ID: <TENANT_ID>" \
-H "Content-Type: application/json" \
-d '{
"operation": "query",
"query": "sum(rate(container_cpu_usage_seconds_total{namespace='\''prod'\''}[5m]))"
}'
{
  "success": true,
  "data": {
    "result_count": 1,
    "data": {
      "status": "success",
      "data": {
        "resultType": "vector",
        "result": [
          {
            "metric": {},
            "value": [1715196600, "0.3481"]
          }
        ]
      }
    }
  }
}
Run time-range trend queries with query_range
Use query_range for time-window PromQL evaluation (GET /api/v1/query_range). Provide query, start, end, and step.
const baseUrl = "https://api.example.com/api/v1";
const tenantId = "<TENANT_ID>";
const apiKey = "<API_KEY>";

async function queryHttpLatencyTrend(integrationId: string) {
  const response = await fetch(`${baseUrl}/integrations/${encodeURIComponent(integrationId)}/execute`, {
    method: "POST",
    headers: {
      "X-API-Key": apiKey,
      "X-Tenant-ID": tenantId,
      "Content-Type": "application/json",
    },
    body: JSON.stringify({
      operation: "query_range",
      query: "histogram_quantile(0.95, sum(rate(http_request_duration_seconds_bucket[5m])) by (le))",
      start: "2026-05-08T18:00:00Z",
      end: "2026-05-08T19:00:00Z",
      step: "60s"
    }),
  });
  if (!response.ok) throw new Error(`Request failed: ${response.status}`);
  return response.json();
}
curl -X POST "https://api.example.com/api/v1/integrations/<ENTITY_ID>/execute" \
-H "X-API-Key: <API_KEY>" \
-H "X-Tenant-ID: <TENANT_ID>" \
-H "Content-Type: application/json" \
-d '{
"operation": "query_range",
"query": "histogram_quantile(0.95, sum(rate(http_request_duration_seconds_bucket[5m])) by (le))",
"start": "2026-05-08T18:00:00Z",
"end": "2026-05-08T19:00:00Z",
"step": "60s"
}'
{
  "success": true,
  "data": {
    "result_count": 1,
    "data": {
      "status": "success",
      "data": {
        "resultType": "matrix",
        "result": [
          {
            "metric": {},
            "values": [
              [1715191200, "0.221"],
              [1715191260, "0.227"]
            ]
          }
        ]
      }
    }
  }
}
Operate reliably in production
Long or high-cardinality PromQL expressions can increase query time and response size. Use targeted label filters, sensible range windows, and step values that match your use case so workflows stay fast and stable.
Connection failures usually come from network routing issues, invalid endpoint URLs, or Prometheus unavailability. Validate endpoint reachability with test, monitor query latency, and use retry with backoff for transient failures.
Related resources
For query syntax and endpoint behavior, see the Prometheus HTTP API documentation and PromQL basics.