Mathematical and Statistical Calculations
Document information
| Field | Value |
|---|---|
| Canonical URL | /docs/03_writing-step-code/65_math-statistics |
| Version (published date) | 2026-05-08 |
| Tags | code-snippets, math, statistics |
Summary
This guide explains practical math and statistics patterns for ProcessFlow step code, including descriptive statistics, percentiles, financial formulas, weighted scoring, and trend metrics. It focuses on repeatable calculations that are safe for automation workflows and analytics pipelines. Use these recipes when process decisions depend on numeric quality and clear statistical outputs.
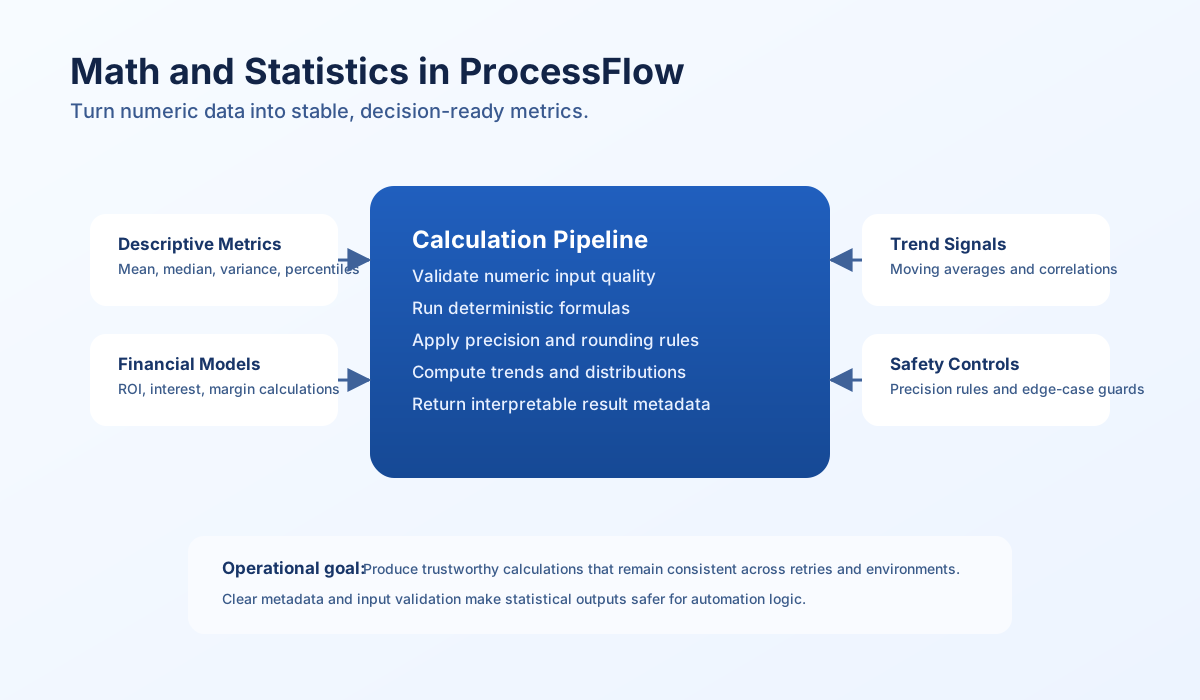
Build reliable numeric pipelines
Most calculation failures come from input quality, not formulas. Filter non-numeric values early, validate required fields, and define precision expectations before you compute results. This approach keeps outputs stable across retries and easier to compare during audits.
For production workflows, return explicit metadata alongside values, such as sample size, precision used, and any dropped inputs. This gives downstream steps enough context to determine whether a result is trustworthy. Transparent calculation context is essential for automated decisions.
Descriptive statistics
Descriptive metrics are a strong default for monitoring and threshold-based process routing. Mean, median, standard deviation, and range give a fast profile of behavior in one response payload. Include count and cleaned input length so consumers can detect when source data is too sparse.
const values = process_input.result?.values ?? []
const numbers = (values as unknown[])
    .map((v) => Number(v))
    .filter((n) => Number.isFinite(n));

if (numbers.length < 1) {
    return { success: false, error: "no numeric values provided" };
}

const sorted = [...numbers].sort((a, b) => a - b);
const count = sorted.length;
const sum = sorted.reduce((a, b) => a + b, 0);
const mean = sum / count;
const middle = Math.floor(count / 2);
const median =
    count % 2 === 0 ? (sorted[middle - 1] + sorted[middle]) / 2 : sorted[middle];

const variance = sorted.reduce((acc, x) => acc + (x - mean) ** 2, 0) / count;
const stdDev = Math.sqrt(variance);

return {
    success: true,
    data: {
        count,
        sum: Number(sum.toFixed(4)),
        mean: Number(mean.toFixed(4)),
        median: Number(median.toFixed(4)),
        min: Math.min(...sorted),
        max: Math.max(...sorted),
        range: Math.max(...sorted) - Math.min(...sorted),
        variance: Number(variance.toFixed(4)),
        std_deviation: Number(stdDev.toFixed(4)),
    },
};
Percentiles and outlier checks
Percentiles and quartiles help distinguish ordinary variation from unusual behavior in event streams. They are especially useful for SLA analysis, pricing distributions, and anomaly detection. Outlier boundaries based on IQR are simple to compute and easy to explain to stakeholders.
const values = process_input.result?.values ?? []
const numbers = (values as unknown[])
    .map((v) => Number(v))
    .filter((n) => Number.isFinite(n))
    .sort((a, b) => a - b);
const count = numbers.length;

if (count < 2) {
    return {success: false, error: "at least 2 numeric values are required"};
}

function percentile(data: number[], p: number): number {
    const n = data.length;
    const index = (p / 100) * (n - 1);
    const lower = Math.floor(index);
    const upper = Math.ceil(index);
    if (lower === upper) return data[lower];
    const fraction = index - lower;
    return data[lower] + (data[upper] - data[lower]) * fraction;
}

const q1 = percentile(numbers, 25);
const q2 = percentile(numbers, 50);
const q3 = percentile(numbers, 75);
const iqr = q3 - q1;
const lowerBound = q1 - 1.5 * iqr;
const upperBound = q3 + 1.5 * iqr;
const outliers = numbers.filter((x) => x < lowerBound || x > upperBound);

return {
    success: true,
    data: {
        quartiles: { q1: Number(q1.toFixed(4)), q2: Number(q2.toFixed(4)), q3: Number(q3.toFixed(4)), iqr: Number(iqr.toFixed(4)) },
        bounds: { lower: Number(lowerBound.toFixed(4)), upper: Number(upperBound.toFixed(4)) },
        outliers,
        outlier_count: outliers.length,
    },
};
Financial and percentage calculations
Financial calculations should define rounding and units explicitly, because different precision assumptions can change outcomes materially. For loan, interest, ROI, and margin flows, enforce denominator checks and return both raw and rounded values when possible. This makes reconciliations easier and avoids hidden arithmetic drift.
type RoiInput = { gain: number; cost: number };

function calculateRoi(input: RoiInput) {
  if (input.cost === 0) throw new Error("Cost cannot be zero");
  const profit = input.gain - input.cost;
  const roiPercent = (profit / input.cost) * 100;
  return {
    gain: input.gain,
    cost: input.cost,
    profit,
    roi_percent: Number(roiPercent.toFixed(2)),
  };
}
Trend and relationship metrics
Running totals, moving averages, and correlation values help process steps identify trajectory rather than single-point state. These metrics are useful for quality monitoring, alert thresholds, and predictive routing decisions. Always include minimum sample-size checks so trend outputs are not used prematurely.
const xInput = process_input.result?.x ?? [];
const yInput = process_input.result?.y ?? [];

const x = (xInput as unknown[]).map((v) => Number(v)).filter((n) => Number.isFinite(n));
const y = (yInput as unknown[]).map((v) => Number(v)).filter((n) => Number.isFinite(n));
const n = Math.min(x.length, y.length);

if (n < 2) {
    return { success: false, error: "need at least 2 paired values" };
}

const xs = x.slice(0, n);
const ys = y.slice(0, n);
const meanX = xs.reduce((a, b) => a + b, 0) / n;
const meanY = ys.reduce((a, b) => a + b, 0) / n;

let covariance = 0;
let varX = 0;
let varY = 0;
for (let i = 0; i < n; i++) {
    const dx = xs[i] - meanX;
    const dy = ys[i] - meanY;
    covariance += dx * dy;
    varX += dx * dx;
    varY += dy * dy;
}

covariance /= n;
varX /= n;
varY /= n;
const stdX = Math.sqrt(varX);
const stdY = Math.sqrt(varY);
const correlation = stdX > 0 && stdY > 0 ? covariance / (stdX * stdY) : 0;

return {
    success: true,
    data: {
        n,
        correlation: Number(correlation.toFixed(4)),
        covariance: Number(covariance.toFixed(4)),
        r_squared: Number((correlation * correlation).toFixed(4)),
    },
};
Calculation safety checklist
Use this checklist before deploying a numeric step:
- Inputs are filtered to numeric values only.
- Division-by-zero and empty-input cases are handled explicitly.
- Precision and rounding rules are documented in the response.
- Sample-size requirements are enforced for statistical metrics.
- Outputs include enough metadata for downstream interpretation.
- Non-deterministic functions (for example random generators) are avoided unless required.